Biden administration's new broadband map shows stark digital divide
The publicly available interactive map differs greatly from the FCC's flawed broadband maps, showing far more unconnected and underconnected communities in the US.


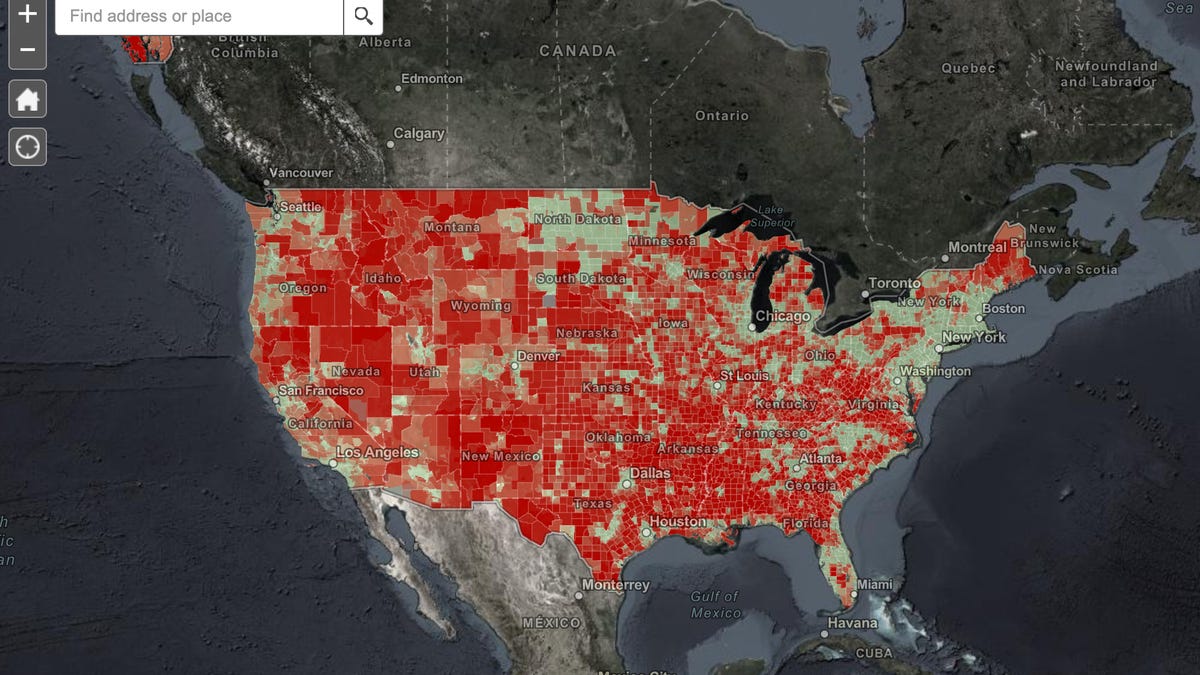
The NTIA map combines datasets from the Census Bureau and the FCC, as well as private companies M-Lab, Ookla and Microsoft to paint a more accurate picture of broadband access in the US.
The Biden administration released a new mapping tool Thursday that gives a more accurate picture of who has broadband and who doesn't. This new map could prove useful as President Joe Biden pushes his massive infrastructure spending agenda, which is expected to include funds to ensure every American has access to broadband.
The National Telecommunications and Information Administration, under the purview of the US Commerce Department, developed the map using a combination of data from both public and private sources. The result is a map that shows far more people not served by broadband than the FCC's maps indicate.
"As we release this important data to the public, it paints a sobering view of the challenges facing far too many Americans as they try to connect to high-speed broadband and participate in our modern economy," Secretary of Commerce Gina Raimondo said in a statement.
The map, which is publicly available and allows anyone to zoom in on an area to check availability, is the first of its kind because it uses information from both public and private entities, including data from the US Census Bureau and the FCC, as well as private companies M-Lab, Ookla and Microsoft. As a result, the new map is more granular than the maps the FCC has been using.

Republicans and Democrats on the FCC and in Congress have long agreed that there are flaws in the FCC's maps, which are used to distribute the billions of dollars in federal funding the agency offers each year to subsidize the cost of building out infrastructure. The biggest issue is that they don't provide an accurate picture of where broadband exists and where it doesn't.
The problem took on a new urgency as the COVID-19 pandemic forced everything from family gatherings to school to work to go online. The shutdowns starting in March 2020 highlighted the fact that millions of Americans across the country lack access to fast internet at home. To address these issues, Biden has called for $100 billion to be spent on getting every American online as part of his massive infrastructure spending proposal.
But knowing where to direct the massive amounts of federal dollars depends on having an accurate picture of where the need exists.
The problem behind the FCC's maps
The issue with the FCC's maps stems from how the data was collected. The FCC relies on self-reported information provided by internet service providers, who report coverage for so-called "census block" areas. These areas can span miles of territory, and if broadband providers report even a single home or business in a particular census block as having service, the FCC counts the entire census block as served. But that's not always the case, especially in rural communities.
The new NTIA map tool is different from the FCC's map, because it contains data aggregated at the county, census tract and census block level to help show a more accurate picture of where quality broadband exists and where it doesn't.
Because the data also includes on-the-ground speed test information, the tool also shows a community's true experience when going online. The result is that many parts of the country where internet access exists report speeds that fall below the FCC's benchmark for fixed broadband service of 25 Mbps download, 3 Mbps upload.
The map also shows the overlap of high-poverty regions and areas that lack broadband access, because the dataset allows you to see where high-poverty communities are located and how that relates to internet usage patterns. It also shows where there's a lack of computers and related equipment. Usage patterns within tribal communities, which have historically suffered from lack of internet access, are also highlighted on the map.
This is the first map that allows users to graphically compare and contrast these different data sources. Users can compare the separate data sets by toggling different fields on and off to gain a better understanding of where broadband needs are greatest.
FCC mapping reform efforts continue
In February, the FCC's acting chair, Jessica Rosenworcel, announced the formation of a new task force dedicated to implementing "long-overdue" upgrades to improve the agency's flawed broadband maps. But the data for the new FCC maps isn't likely to be available until next year.
The Biden administration has said that NTIA mapping tool introduced today is not a replacement for the efforts being done at the FCC. And the new map won't be used to direct federal funds.
Rosenworcel applauded the NTIA's efforts and said she looks forward to working with the agency to develop more accurate maps.
"To ensure that every household has the internet access necessary for success in the digital age, we need better ways to accurately measure where high-speed service has reached Americans and where it has not," she said in a statement. "The latest mapping effort by NTIA is a welcome new tool that provides valuable insight into the state of broadband across the country."
The FCC, she said, looks forward to continuing its collaboration with the Commerce Department and other federal partners to "fulfill the goal of connecting 100 percent of Americans."